Mary’s Meals works in 14 countries across Africa, Asia, Latin America, and the Caribbean to ensure children receive one daily meal in their place of education. We connected with Programmes Policy and Impact Officer Christopher Martin about innovations in survey design, how he collaborates with country teams, and what they have learned so far.
Tell us a little about the assessment you are working on.
Mary’s Meals is currently conducting three longitudinal quasi-experimental impact assessments on our programs in Malawi, Zambia, and Liberia. These research projects are assessing our impact on levels of hunger among children while they are at school, attendance, enrollment, and progression. To measure these and other indicators we have been using a set of surveys and focus group discussion guides for teachers, students, and community members.
Where are you in the project now?
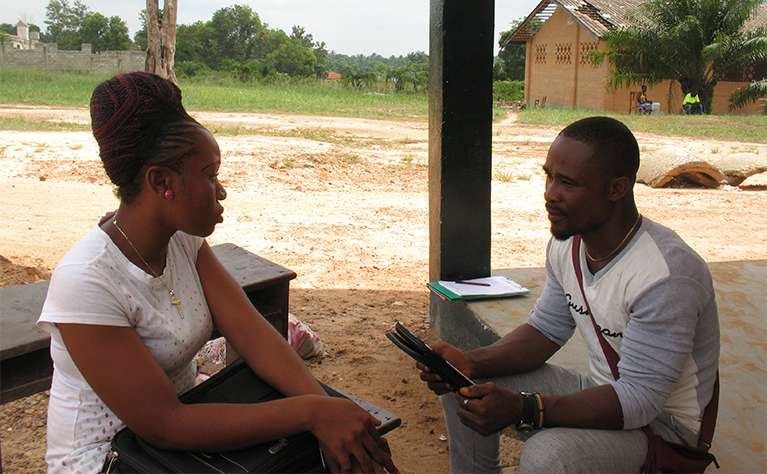
Recently, the M&E team in Liberia and I have been working to collect our first full year of data. At baseline, we had conducted over 1,300 paper surveys. This year, we have used tablets and SurveyCTO to speed up and improve the accuracy of the project. While we have yet to complete the analysis process for our work in Zambia and Liberia, we have produced a year one report for our assessment in Malawi which shows how the initial impacts of our program contribute towards reductions in classroom hunger, increased enrollment, and reductions in reported levels of anxiety around hunger.
What are some of the innovative ways you’re using SurveyCTO?
While we are also using SurveyCTO in our impact assessments in Malawi and Zambia, in Liberia we have used the software to provide a simple way of allowing our team of enumerators to match students’ baseline survey with their year one response. We are hoping this will provide us an accurate and powerful method for examining at how our program is contributing to changes in the lives of individual students in Liberia.
Is there anything else you’d like to share about the project or survey design in general? Any advice for others?
From working on these three projects, my colleagues and I have come to value the time we spend discussing the concepts used in our surveys. While this may seem like a straightforward piece of advice, it is essential to develop a shared and contextualized understanding of how to explain concepts like “hunger,” “enrolment,” “attendance,” and even “primary and secondary school age” to young students. We have found that using images in our surveys, like a picture of a battery to explain “energy,” can help enumerators and participants in our research to produce accurate results.


